
What is SSRS?
SQL Server Reporting Services (SSRS) is a server-based report generation software system from Microsoft. It is part of suite of Microsoft SQL Server services, including SSAS (SQL Server Analysis Services) and SSIS (SQL Server Integration Services).
SQL Server Reporting Services provides a full range of ready-to-use tools and services to help you create, deploy, and manage reports for your organization. Reporting Services includes programming features that enable you to extend and customize your reporting functionality.
Reporting Services is a server-based reporting platform that provides comprehensive reporting functionality for a variety of data sources. Reporting Services includes a complete set of tools for you to create, manage, and deliver reports, and APIs that enable developers to integrate or extend data and report processing in custom applications. Reporting Services tools work within the Microsoft Visual Studio environment and are fully integrated with SQL Server tools and components.
|
Showing posts with label SSRS. Show all posts
Showing posts with label SSRS. Show all posts
SSRS Tutorials - An Introduction
SSRSSSRS Tutorials - An IntroductionIn this set of tutorials, we will be learning microsoft sql server 2008 reporting services. This set of tutorials, is designed for anyone with absolutely no experience in business intelligence SSRS or sql server reporting services. We will also walk through sql reporting services configuration, creating your first report, deploying, security etc.
we will use the adventure works database, which is available here.
|
SSRS Access Denied
SSRSHow to fix Reporting Services permissions are insufficient for performing operation (rsAccessDenied)
Learn how to configure and access SQL Server Reporting Services reports when you get The permissions granted to user 'domain\username' are insufficient for performing this operation. (rsAccessDenied)
If you are getting the following error while trying to access or deploy a SQL Services Reporting Services (ssrs) report server on your localhost:
The permissions granted to user 'domain\username' are insufficient for performing this operation. (rsAccessDenied)
Solution 1
If you are working on local system and don't need to assign role/permission.
1. Right Click Microsoft BI -> Click Run as Administrator -> either open your existing SSRS report or create your new SSRS report and then deploy your report after that complied you will be received one web URL for to view your report. Copy that URL and paste to web browser(Run as Administrator) and you will get your report view.
2. Right Click on IE and "Run as Administrator".
Solution 2
- Make sure you have access configured to the URL http://localhost/reports using the SQL Reporting Services Configuration. To do this:
- Open Reporting Services Configuration Manager -> then connect to the report server instance -> then click on Report Manager URL.
- In the Report Manager URL page, click the Advanced button -> then in the Multiple Identities for Report Manager, click Add.
- In the Add a Report Manager HTTP URL popup box, select Host Header and type in: localhost
- Click OK to save your changes.
- Now start/ run Internet Explorer using Run as Administator...
- Now start/ run Internet Explorer using Run as Administator...
- Then go to: http://localhost/reports (you may have to login with your Computer's username and password)
- You should now be directed to the Home page of SQL Server Reporting Services here: http://localhost/Reports/Pages/Folder.aspx
- From the Home page, click the Properties tab, then click New Role Assignment
- In the Group or user name textbox, add the 'domain\username' which was in the error message (in my case, I added: qaskhk-PC\qaskho for the 'domain\username', in your case you can find the domain\username for your computer in the rsAccessDenied error message).
- Now check all the checkboxes; Browser, Content Manager, My Reports, Publisher, Report Builder, and then click OK.
- You're domain\username should now be assigned to the Roles that will give you access to deploy your reports to the Report Server. If you're using Visual Studio or SQL Server Business Intelligence Development Studio to deploy your reports to your local reports server, you should now be able to.
- Hopefully, that helps you solve your Reports Server rsAccessDenied error message...
Just to let you know this tutorial was done on a Windows 8 computer with SQL Server Reporting Services 2008.
SSRS Installation
SSRSSQL Server Reporting Services Installation
Lets move forward with getting to know how to install sql server 2008 reporting services. Please note, most of the steps are the same for installing sql server reporting services 2005.
|


Report Creation with the Wizard
SSRSSQL Server Reporting Services with using the Wizard
In this section, we will use the Report Wizard to build a report. Let's go through the following steps:
- Open Business Intelligence Development Studio
- Launch the report wizard
- Create a shared data source
- Design a query
- Select a report type
- Design a table
- Choose the table layout
- Complete the wizard
Open Business Intelligence Development Studio (BIDS) (Start --> Microsoft SQL server 2008 --> SQL server Business Intelligence studio

Click File --> New project --> Report Server Project Wizard. Give any name and location.

Once you click OK, you will be presented with the following screen.

Click Next. Now configure your connection string. I have chosen the type as 'Microsoft SQL server'.

The Data Source contains the information necessary to retrieve the data we pull in our report. Reporting Services can access data in relational databases, OLAP databases, and any other data source for which like an ODBC or OLE DB driver, etc.
When we create a Data Source, we can specify it as shared which means it can be used by any report in the same project. If a Data Source isn't shared, it means that its definition is stored inside the report and it cannot be shared with another report.
After launching the Report Wizard, you will be presented with the Select the Data Source dialog as shown below:
In this step, you need to enter the query for the data, that you need the SSRS report to be populated with. You can also use the query builder.

Click on query builder, and click on the right most top icon, to add tables

Select the necessary table, and verify your query, then click the (!) icon to see the result of the query after execution.

If everything looks good, click on Next

Click Next

Add the fields, as shown in the below screenshot.

Click next

Choose a style, and click next.

Choose a deployment location. It will be in the form (http://machinename/Reportserver)

Click Next

You can preview the report in Business Intelligence Development Studio.

Now, Right click the project , and click deploy.

After successfully deploying the project, open up IE, and hit http://machinename/reports

Click on your report to open it.

Congratulations! You have made your first SSRS report.
Installing Sample Databases
SSRSInstalling Sample databases (Adventure Works)
Next, lets install some sample databases for us to work with. One of the most commonly used databases is the SQL adventureworks database. SQL server adventureworks database download is available here.
Once you download the database, lets look at how to setup sql database.
Step 1: Install your downloaded database (sql server 2008 sample databases download), by choosing the correct instance name.

Step 2: After installation, open SSMS --> your instance name, then check if the below databases are visible.

Step 3: You can also install some sample reports from here.
SSRS Architecture
SSRSBrief Overview
SQL Server 2008 product included one of the services called as "SQL Server Reporting Services 2008 (SSRS)". SSRS is a full-featured application that provides report design, development, testing, and deployment of reports by the use of Business Intelligence Development Studio (BIDS) developer tool for all its operations.
SSRS block diagram as shown below has been taken from an online book for reference purposes:

- Reporting Services include an HTTP listener that monitors incoming requests directed to HTTP.SYS on a specific port on the local computer. The host name and port are specified on a URL reservation when you configure the server.
- Report Manager is an ASP.NET application that provides a browser-based interface for managing Reporting Services.
- Reporting Services include an Authentication Layer that verifies the identity of the user or application that makes the request. The following authentication types are supported: Windows integrated security, NTLM authentication, Basic authentication, Forms or custom authentication, and Anonymous access. Reporting Services uses Windows integrated security and NTLM authentication by default.
- The Web Service is also implemented as an ASP.NET application; it provides a programmatic interface to Reporting Services.
- By default, reporting services creates and uses two SQL Server 2008 databases instances named ReportServer and ReportServerTempDB. The ReportServerTempDB database is used for temporary storage.
Report Creation with the Non-Wizard
SSRSSQL Server Reporting Services without using the Wizard
In my previous article, we created a SQL server report using the wizard. However, the wizard has it's own limitations towards the customization of reports and stuff. Therefore, it would be awesome if the report be generated without use of wizards. Lets get started with the same.
Most of the report development that you do using Microsoft SQL server reporting services, would be using the non-wizard method. This allows more flexibility to your report development.
Open Microsoft Business Intelligence studio, and create a report server project.
Next lets configure the datasources and datasets.

Right click on the "Data sources" folder and add a new data source. Set the connection string to point to your new adventure works database.
Once that is done, right click on the datasets folder, to add a dataset. This is basically the place, where you will configure your query that returns some data, that you want to be displayed in the report.
Select the datasource, that you just created and type in a query.
You could also use the "Query Designer" if you want.

After eveything is done, click ok
Now from the toolbox, drag and drop a table control.

From the "Report Data", drag and drop the columns defined in the dataset, that you want in the report.

That's it, click on the preview tab and congratulations, you have made your first Microsoft SQL server report using a non-wizard method.

SSRS Expressions
SSRSReporting Services Expressions
In Reporting Services, Expressions are used frequently in reports to control content and report appearance. Expressions are used throughout the report definition to specify or calculate values for parameters, queries, filters, report item properties, group and sort definitions, text box properties, bookmarks, document maps, dynamic page header and footer content, images, and dynamic data source definitions.
Expressions begin with an equal (=) and are written in Visual Basic. Expressions can include a combination of constants, operators, and references to built-in values (fields, collections, and functions), and to external or custom code.
Expressions can be one of the following two types:
- Simple - An expression that is a single reference to an item in a built-in collection, such as, a dataset field, a parameter, or a built-in field. Simple expressions appear on the design surface and in dialog boxes in brackets, such as [FieldName], which represents the underlying expression =Fields!FieldName.Value. You can type simple expressions directly into a text box on the design surface and the corresponding expression text is set as the value of a placeholder inside the text box.
- Complex - An expression that includes more than a simple reference. Complex expressions appear on the design surface as <>. You can create complex expressions in the Expression dialog box or type them directly into the Property pane.
Lets look at a very simple example.
Step 1: Create a report server project and connect to Adventure Works Database.

Step 2: Add the SalesOrderDetail table with a couple of columns to the Report.
Step 3: In the toolbox, add the table control to the report.

Step 4: Add 3 columns to the report - SalesOrderID, SalesOrderDetailID, OrderQty, LineTotal.
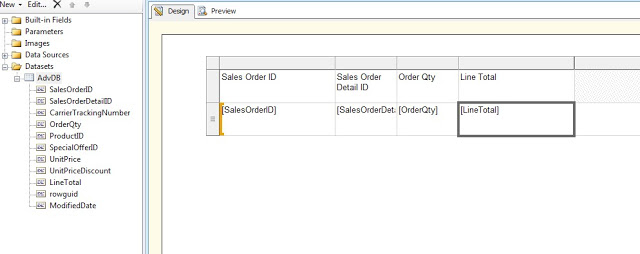
Step 5: Now lets write some expressions. We will display anything in LineTotal cell as Green, if the number is above 2000, else we will display in Red.
Right click on the cell , and select text-box properties.


Step 6: Next to the colr dropdown, there is an Fx button.
Write the below expression.
=IIF(Fields!LineTotal.Value >= 2000, "Green", "Red")

Step 7 : Click OK and then on the Preview button.
You should be getting the final output as displayed below.

Step 8: Now lets write some expressions to manipulate some data.
Right click on the OrderQuantity Cell and click on expressions.
Enter the below expression and click OK.

Step 9: Click on the preview tab, you should get the below output.

I have demonstrated a very simple use of expressions. However , you can write very complex expressions depending on your business needs. For instance, you can write expressions, to calculate the standard deviation of so and so , and manipulate results accordingly.
Many time, you need to write expressions to deal with Dates and times
For information on: http://msdn.microsoft.com/en-us/library/ms157328.aspx
Thanks for reading my post, and let me know of your feedback
Subscribe to:
Posts (Atom)