In Reporting Services, Expressions are used frequently in reports to control content and report appearance. Expressions are used throughout the report definition to specify or calculate values for parameters, queries, filters, report item properties, group and sort definitions, text box properties, bookmarks, document maps, dynamic page header and footer content, images, and dynamic data source definitions.
Expressions begin with an equal (=) and are written in Visual Basic. Expressions can include a combination of constants, operators, and references to built-in values (fields, collections, and functions), and to external or custom code.
Expressions can be one of the following two types:
Simple - An expression that is a single reference to an item in a built-in collection, such as, a dataset field, a parameter, or a built-in field. Simple expressions appear on the design surface and in dialog boxes in brackets, such as [FieldName], which represents the underlying expression =Fields!FieldName.Value. You can type simple expressions directly into a text box on the design surface and the corresponding expression text is set as the value of a placeholder inside the text box.
Complex - An expression that includes more than a simple reference. Complex expressions appear on the design surface as <>. You can create complex expressions in the Expression dialog box or type them directly into the Property pane.
Lets look at a very simple example.
Step 1: Create a report server project and connect to Adventure Works Database.
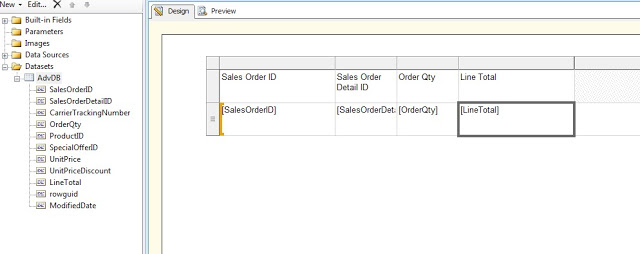
Step 2: Add the SalesOrderDetail table with a couple of columns to the Report.
Step 3: In the toolbox, add the table control to the report.
Step 4: Add 3 columns to the report - SalesOrderID, SalesOrderDetailID, OrderQty, LineTotal.
Step 5: Now lets write some expressions. We will display anything in LineTotal cell as Green, if the number is above 2000, else we will display in Red. Right click on the cell , and select text-box properties.
Step 6: Next to the colr dropdown, there is an Fx button. Write the below expression. =IIF(Fields!LineTotal.Value >= 2000, "Green", "Red")
Step 7 : Click OK and then on the Preview button. You should be getting the final output as displayed below.
Step 8: Now lets write some expressions to manipulate some data. Right click on the OrderQuantity Cell and click on expressions. Enter the below expression and click OK.
Step 9: Click on the preview tab, you should get the below output.
I have demonstrated a very simple use of expressions. However , you can write very complex expressions depending on your business needs. For instance, you can write expressions, to calculate the standard deviation of so and so , and manipulate results accordingly. Many time, you need to write expressions to deal with Dates and times For information on: http://msdn.microsoft.com/en-us/library/ms157328.aspx
Thanks for reading my post, and let me know of your feedback