List of popular DWH and Business Intelligence Solutions

List of popular DWH and Business Intelligence Solutions

  • TeraData
  • MicroStrategy
  • Oracle Business Intelligence
  • Tableau
  • QlikView
  • Microsoft BI
  • SAP BI
  • SAS BI
  • IBM Cognos
  • BizzScore Suite
  • Pentaho BI Suite
  • JasperSoft BI Suite
  • RapidMiner

Business Intelligence tools are application software programs designed for reporting, analyzing and presenting data. These tools are helpful in reading data already stored in data mart or data warehouse, and with this information, a business can reach new heights of success in today’s competitive marketplace.

One of the most important and most common Business Intelligence tools is the Microsoft Excel. This is mainly because this program is relatively cheap and is easily accessible. It is commonly used and is available on almost any computer system. An Excel sheet can be sent easily and quickly to a person and you do not need to worry whether the person will be able to read the numbers or not. Microsoft Excel has most of the functionality that a user may need for displaying and reading data.


Because of such a huge popularity of Microsoft Excel program, almost all the third party reporting and OLAP tools have a function to ‘export to Excel’. With all these features, Microsoft Excel seems to be the best program for reporting business operations and tracking goals.

Another important Business Intelligence tool is a reporting tool which can be both commercial and custom built. It provides flexibility to the users to create, run and schedule their reports as per their individual choices and preferences. OLAP tools are also commonly used by the advanced users who want to look at their data from several multiple dimensions, and utilizing these data in strategic business planning.
Data mining tools are also important Business Intelligence tools, but they are used only by a handful of people, even in large organizations. These tools are basically used to find a co-relation between different factors of a business and its competition, and that is why, it remains an important tool to be used for Business Intelligence.
As a conclusion, you will find that these Business Intelligence tools are a great investment for your business as they will provide you an aid that you will not be able to ignore. By using the right set of tools for your organization, you will not only improve the overall performance of your business but you will also be able to keep your clients happy and satisfied.

With the right set of Business Intelligence tools and implementing them in the right areas of your business, you will be able to receive healthy returns on business investment within no time. All in all, the information that users get through these tools will help business enterprise in staying ahead of the competition, and thus, contribute a vital role of business performance and growth.


Business Intelligence

Business Intelligence

Process to get information about business from available data is known as Business Intelligence.

Business intelligence can be defined as having the right access to the right data or information needed to make the right business decisions at the right time. The data might be raw or might have been analyzed in some way. Having access to such information enables management of the business by fact instead of by primarily relying on intuition.

We’re here to help you understand basic BI concepts. In this Beginner’s Guide to Business Intelligence, we’ll introduce three foundational BI components, explain why and when you would need to use them, and share examples of vendors that offer these capabilities. The three components we’ll cover are:

  • Data Warehouses
  • Extract, Transform and Load (ETL)
  • Online Analytical Processing (OLAP)

What is a Data Warehouse?

A data warehouse stores… data. But its technology is much more sophisticated than its name. A data warehouse allows you to consolidate data from several sources (i.e. other software systems) and then perform queries and analyses.

A data warehouse is a subject-oriented, integrated, time-variant, nonvolatile collection of data in support of management’s decision-making process.” Bill Inmon (1992).

Subject-Oriented: A data warehouse can be used to analyze a particular subject area. For example, "sales" can be a particular subject.

Integrated: A data warehouse integrates data from multiple data sources. For example, source A and source B may have different ways of identifying a product, but in a data warehouse, there will be only a single way of identifying a product.

Time-Variant: Historical data is kept in a data warehouse. For example, one can retrieve data from 3 months, 6 months, 12 months, or even older data from a data warehouse. This contrasts with a transactions system, where often only the most recent data is kept. For example, a transaction system may hold the most recent address of a customer, where a data warehouse can hold all addresses associated with a customer.

Non-volatile: Once data is in the data warehouse, it will not change. So, historical data in a data warehouse should never be altered.

A data warehouse is a database designed for querying, reporting, and analysis.
Data is raw material & unorganized facts that need to be processed 

When data are processed, organized, structured or presented in a given context so as to make them useful, they are called Information.


What is Extract, Transform and Load (ETL)?

ETL tools perform three functions to move data from one place to another:

  • Extract data from sources such as ERP or CRM applications;
  • Transform that data into a common format that fits with other data in the warehouse; and,
  • Load the data into the data warehouse for analysis.

The ETL concept sounds easy, but the execution is complex. We’re not talking about simple copy and paste stuff here. Each step in the process has its challenges. For example, during the extract step, data may come from different source systems (e.g. Oracle, SAP, Microsoft) and different file formats such as XML, flat files with delimiters (e.g. CSV), or the worst – old legacy systems that store data in arcane formats no one else uses anymore.

What is Online Analytical Processing (OLAP)?


OLAP (online analytical processing) is computer processing that enables a user to easily and selectively extract and view data from different points of view.

For example, a user can request that data be analyzed to display a spreadsheet showing all of a company's beach ball products sold in Florida in the month of July, compare revenue figures with those for the same products in September, and then see a comparison of other product sales in Florida in the same time period.

On-line retrieval and analysis of data to reveal or expose business trends and statistics not directly visible in the data directly retrieved from a data warehouse. Also known as multidimensional analysis.
Online analytical processing (OLAP) is another key process and technology found in almost all data warehouse environments and business intelligence systems. But while the data warehouse and ETL tools support “back end” processes, OLAP tools support the presentation layer or “front end” processes such as querying, analysis and reporting. OLAP tools provide the impressive tables, charts and visualizations that make BI exciting!


SQL Joins

SQL Joins

The SQL Joins clause is used to combine records from two or more tables in a database. A JOIN is a means for combining fields from two tables by using values common to each.
There are different types of joins available in SQL:


  • INNER JOIN: returns rows when there is a match in both tables.
  • LEFT JOIN: returns all rows from the left table, even if there are no matches in the right table.
  • RIGHT JOIN: returns all rows from the right table, even if there are no matches in the left table.
  • FULL JOIN: returns rows when there is a match in one of the tables.
  • SELF JOIN: is used to join a table to itself as if the table were two tables, temporarily renaming at least one table in the SQL statement.


To use JOIN in a query statement, the query writer must know the structure of the tables. There must be at least one column of data between the two tables which matches for a JOIN to work properly. This information must be provided to the SQL server as part of the query.

Generally, the data involved in a JOIN operation is composed of a “primary” key value in one table and a “foreign” key value in another. A primary key is usually a unique identity value in a table. A foreign key exists in a table which is in some way related to the unique record in the table holding the primary key.

Left JOIN and Right JOIN
There are multiple types of JOIN statements. Each has a slightly different function. JOIN commands refer to the order in which the data is merged together. One of the most common JOIN statements is a LEFT JOIN. In a LEFT JOIN, all data from the table with the primary key value are returned as well as rows from the table holding the foreign key if there is a match. Rows in the foreign key table that do not match a value in the primary key table are ignored.

A RIGHT JOIN is very similar to a LEFT JOIN. As the name suggests, this JOIN type returns the exact opposite result of a LEFT JOIN. The RIGHT JOIN will return all rows from the table holding the foreign key in addition to rows from the primary key table that match. Rows from the primary key table that do not have a corresponding foreign key value are ignored.

Inner, Full, and Cross JOIN
An INNER JOIN statement will compare the data in both tables and return only those rows from each table where a match has occurred. Rows in both the primary key table and foreign key table that do not have a corresponding row in the other table will be ignored. A FULL JOIN is the opposite of an INNER JOIN. A JOIN of this variety returns all rows from each table, aligning data when a match exists.

Another variety of JOIN types, though used less commonly, is the CROSS JOIN. A CROSS JOIN ignores the key values provided and JOINS every row of the primary table with every row of the secondary table. This produces a Cartesian result set. This type of JOIN could be useful for viewing all possible combinations of cars and car paint colors, as an example.


Examples

SELECT e.last_name, e.first_name, e.salary,d.department_id

FROM employees e, departments d
where e.department_id = d.department_id


SELECT e.last_name, e.salary, j.grade_level
FROM employees e, job_grades j
WHERE e.salary BETWEEN j.lowest_sal AND j.highest_sal;


SELECT e.last_name, e.first_name, e.salary,d.department_id
FROM employees e full outer join departments d
on e.department_id = d.department_id

SELECT e.last_name, e.first_name, e.salary,d.department_id
FROM employees e , departments d
where e.department_id(+) = d.department_id

SELECT e.last_name, e.department_id, d.department_name
FROM employees e LEFT OUTER JOIN departments d
ON (e.department_id = d.department_id);

SELECT e.last_name, e.department_id, d.department_name
FROM employees e
RIGHT OUTER JOIN departments d
ON (e.department_id = d.department_id);

SELECT e.last_name, e.department_id, d.department_name
FROM employees e
FULL OUTER JOIN departments d
ON (e.department_id = d.department_id);

Self Joins e.g

SELECT worker.last_name || ' works for '
|| manager.last_name
FROM employees worker, employees manager

WHERE worker.manager_id = manager.employee_id;

SSRS Expressions

Reporting Services Expressions

In Reporting Services, Expressions are used frequently in reports to control content and report appearance. Expressions are used throughout the report definition to specify or calculate values for parameters, queries, filters, report item properties, group and sort definitions, text box properties, bookmarks, document maps, dynamic page header and footer content, images, and dynamic data source definitions.

Expressions begin with an equal (=) and are written in Visual Basic. Expressions can include a combination of constants, operators, and references to built-in values (fields, collections, and functions), and to external or custom code.

Expressions can be one of the following two types:

  • Simple - An expression that is a single reference to an item in a built-in collection, such as, a dataset field, a parameter, or a built-in field. Simple expressions appear on the design surface and in dialog boxes in brackets, such as [FieldName], which represents the underlying expression =Fields!FieldName.Value. You can type simple expressions directly into a text box on the design surface and the corresponding expression text is set as the value of a placeholder inside the text box.
  • Complex - An expression that includes more than a simple reference. Complex expressions appear on the design surface as <>. You can create complex expressions in the Expression dialog box or type them directly into the Property pane.

Lets look at a very simple example.

Step 1: Create a report server project and connect to Adventure Works Database.


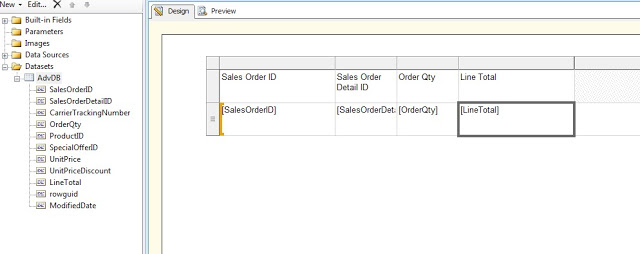
Step 2: Add the SalesOrderDetail table with a couple of columns to the Report.

Step 3: In the toolbox, add the table control to the report.


Step 4: Add 3 columns to the report - SalesOrderID, SalesOrderDetailID, OrderQty, LineTotal.


Step 5: Now lets write some expressions. We will display anything in LineTotal cell as Green, if the number is above 2000, else we will display in Red.
Right click on the cell , and select text-box properties.


Step 6: Next to the colr dropdown, there is an Fx button.
Write the below expression.
=IIF(Fields!LineTotal.Value >= 2000, "Green", "Red")


Step 7 : Click OK and then on the Preview button.
You should be getting the final output as displayed below.


Step 8: Now lets write some expressions to manipulate some data.
Right click on the OrderQuantity Cell and click on expressions.
Enter the below expression and click OK.


Step 9: Click on the preview tab, you should get the below output.


I have demonstrated a very simple use of expressions. However , you can write very complex expressions depending on your business needs. For instance, you can write expressions, to calculate the standard deviation of so and so , and manipulate results accordingly.
Many time, you need to write expressions to deal with Dates and times
For information on: http://msdn.microsoft.com/en-us/library/ms157328.aspx

Thanks for reading my post, and let me know of your feedback


Design SSRS Parameterized Report

Design Parameterized Report using SSRS 2008

In this article, we will see how to create a SSRS report with parameters. We will create the parameters and then add these parameters to our reports, in different ways. For this demonstration, we will use SQL Server 2008 database 'AdventureWorks' for designing the report as well as parameters.

This article is a continuation of 'SQL Server Reporting Services without using the Wizard'. If you have not gone through it, I will highly recommend you to go through it first and then start with this article.

We are going to expose the postal code as a parameter. This means, we will see the address of only the entered postal code.

Modify the query in the dataset, to make PostalCode as a parameter


Once you click OK, go to the parameters folder in "Report Data" - you will find that @postalcode automatically appears in the "Parameters" Fields.

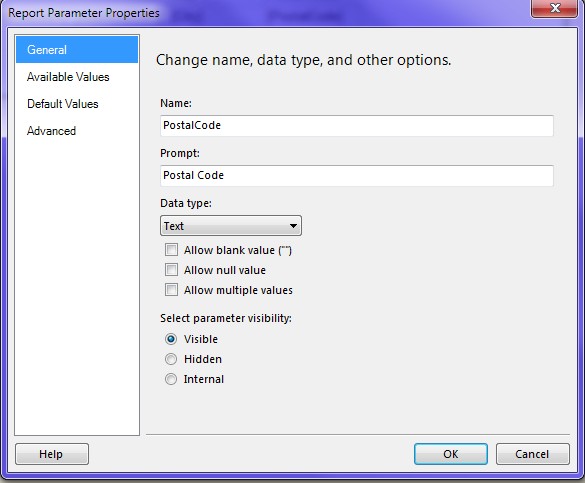
Lets explore more about the parameter. Double click on @postalcode.
This is place, where you configure, how your parameter should behave - should it allow blank values or null values etc.
You can configure the visibility, data-types, default values etc. Lets leave it as it is for now.


Click preview, and enter in a postal code (91373 for example)


Note: Observe that the parameter appears as a text box here. If you want pre-configured values (in a dropdown), double click on the parameter in "ReportData" --> Parameters (here, @postalcode) and click "Available Values"/"Default value" and click "Get values from a query". You can choose your dataset and corresponding column. Create multiple datasets to suffice your parameter value requirements.

Create a Basic Table Report

Create a Basic SSRS Table Report

This tutorial is designed to help you create a basic table report based on the Adventure Works database using Report Designer. You can also use Report Builder or the Report Wizard to create reports. In this tutorial, you will create a report project, set up connection information, define a query, add a Table data region, group and total some fields, and preview the report.

Lets look at some basic steps to create a SSRS tabular report.

Step 1: Create an SSRS report server project.

Step 2: Next add a blank report to your project.

Step 3:
Next we need to create a Dataset.
In the Report data tab, right click on Datasets and complete the wizard.


Step 4: Add a query to get some data to your report.


Step 5:
Now drag and drop a table control from the tool box (Left hand pane)
In the table control, drag and drop some fields from your dataset.
Once done, your Design pane should look something like this.


Step 6: Click on the preview tab, and you should be able to see a very basic tabular report.

Step 7: You could also add some totals to your report.
In order to add totals, right click on the cell where you would like to add the totals, click on 'Add Total'.
Click preview and you should be able to see a tabular report with totals.


Formatting a Report

Formatting a Report (Reporting Services)

Now that you've added a data region and some fields to the Sales Orders report, you can format the date and currency fields and the column headers.

Lets look at some basic steps to create a SSRS tabular report.

In this topic:

  • Format the Date
  • Format the Currency
  • Change Text Style and Column Widths

Step 2: Next add a blank report to your project.

Step 3:
Next we need to create a Dataset.
In the Report data tab, right click on Datasets and complete the wizard.

Format the Date

The Date field displays date and time information by default. You can format it to display only the date.

To format a date field
  1. Click the Design tab.
  2. Right-click the cell with the [Date] field expression and then click Text Box Properties.
  3. Click Number, and then in the Category field, select Date.
  4. In the Type box, select January 31, 2000.
  5. Click OK.
  6. Preview the report to see the change to the [Date] field and then change back to design view.

Format the Currency

The LineTotal field displays a general number. Format it to display the number as currency.

To format a currency field
  1. Right-click the cell with the [LineTotal] field expression and then click Text Box Properties.
  2. Click Number, and in the Category field, select Currency.
  3. If your regional setting is English (United States), the defaults should be:
    - Decimal places: 2
    - Negative numbers: ($12345.00)
    - Symbol: $ English (United States)
  4. Select Use 1000 separator (,). If the sample text is:$12,345.00, then your settings are correct.
  5. Click OK.
  6. Preview the report to see the change to the [LineTotal] field and then change back to design view.

Change Text Style and Column Widths

You can also change the formatting of the header row to differentiate it from the rows of data in the report. Lastly, you will adjust the widths of the columns.

To format header rows and table columns
  1. Click the table so that column and row handles appear above and next to the table.
  2. Point to the line between column handles so that the cursor changes into a double arrow. Drag the columns to the size you want.
  3. Select the row containing column header labels and from the Format menu, point to Font and then click Bold.
  4. To preview your report, click the Preview tab. It should look something like this:
  5. On the File menu, click Save All to save the report.

Adding Grouping and Totals

Adding Grouping and Totals (Reporting Services)

Add grouping and totals to your report to organize and summarize your data.

In this topic:

  • To group data in a report
  • To add totals to a report
  • To add a daily total to a report
  • To add a grand total to a report
  • To Publish the Report to the Report Server (Optional)
To group data in a report
  1. Click the Design tab.
  2. If you do not see the Row Groups pane , right-click the design surface and click view and then click Grouping.
  3. From the Report Data pane, drag the Date field to the Row Groups pane. Place it above the row called (Details).
    Note that the row handle now has a bracket in it, to show a group. The table now also has two Date columns -- one on either side of a vertical dotted line.
  4. From the Report Data pane, drag the Order field to the Row Groups pane. Place it below Date and above (Details).
    Note that the row handle now has two brackets in it, to show two groups. The table now has two Order columns, too.
  5. Delete the original Date and Order columns to the right of the double line. This removes this individual record values so that only the group value is displayed. Select the column handles for the two columns, right-click and click Delete Columns.

    You can format the column headers and date again.

  6. Switch to the Preview tab to preview the report. It should look similar to the following illustration:
To add totals to a report
  1. Switch to Design view.
  2. Right-click the data region cell that contains the field [LineTotal], and click Add Total.
    This adds a row with a sum of the dollar amount for each order.
  3. Right-click the cell that contains the field [Qty], and click Add Total.
    This adds a sum of the quantity for each order to the totals row.
  4. In the empty cell to the left of Sum[Qty], type the label "Order Total".
  5. You can add a background color to the totals row. Select the two sum cells and the label cell.
  6. On the Format menu, click Background Color, click Light Gray, and click OK.

To add a daily total to a report
  1. Right-click the Order cell, point to Add Total, and click After.
    This adds a new row containing sums of the quantity and dollar amount for each day, and the label "Total" in the Order column.
  2. Type the word Daily before the word Total in the same cell, so it reads Daily Total.
  3. Select the Daily Total cell, the two Sum cells and the empty cell between them.
  4. On the Format menu, click Background Color, click Orange, and click OK.
To add a grand total to a report
  1. Right-click the Date cell, point to Add Total, and click After.
    This adds a new row containing sums of the quantity and dollar amount for the entire report, and the Total label in the Date column.
  2. Type the word Grand before the word Total in the same cell, so it reads Grand Total.
  3. Select the Grand Total cell, the two Sum cells and the empty cells between them.
  4. On the Format menu, click Background Color, click Light Blue, and click OK.
    The last page should look something like this:
  5. Click Preview.
    The last page should look something like this:


What is SQL?

What is SQL?


  • SQL stands for Structured Query Language
  • SQL lets you access and manipulate databases
  • SQL is an ANSI (American National Standards Institute) standard


SQL (pronounced "ess-que-el") stands for Structured Query Language. SQL is used to communicate with a database. According to ANSI (American National Standards Institute), it is the standard language for relational database management systems. SQL statements are used to perform tasks such as update data on a database, or retrieve data from a database.

RDBMS

RDBMS stands for Relational Database Management System.

RDBMS is the basis for SQL, and for all modern database systems such as MS SQL Server, IBM DB2, Oracle, MySQL, and Microsoft Access.

The data in RDBMS is stored in database objects called tables.

A table is a collection of related data entries and it consists of columns and rows.


Writing SQL Statements

Using the following simple rules and guidelines, you can construct valid statements that are both easy to read and easy to edit:
• SQL statements are not case sensitive, unless indicated.
• SQL statements can be entered on one or many lines.
• Keywords cannot be split across lines or abbreviated.
• Clauses are usually placed on separate lines for readability and ease of editing.
• Indents should be used to make code more readable.
• Keywords typically are entered in uppercase; all other words, such as table names and columns, are entered in lowercase.

Executing SQL Statements

Using iSQL*Plus, click the Execute button to run the command or commands in the editing window.


What is an Operator in SQL?

What is an Operator in SQL?

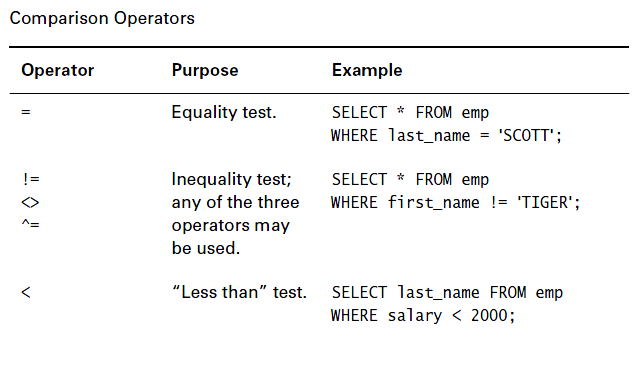
An operator is a symbol specifying an action that is performed on one or more expressions. The following tables lists the operator categories that SQL Server uses.

Arithmetic operators

Comparison operators

Logical operators

Set Operators


Operator Precedence (  *    /    +   - )
Unary Operator A unary operator has only one operand. +2 and –5 are examples.
They have the format <operator operand>.
Binary Operator Binary operators have two operands. 5 + 4 and 7 x 5 are examples.

They have the format <operand1 operator operand2>.


Types of SQL Functions

Types of SQL Functions

There are two distinct types of functions:
  1. Single-row functions
  2. Multiple-row functions

Single-Row Functions

These functions operate on single rows only and return one result per row. There are different types of single-row functions. This lesson covers the following ones:

  • Character
  • Number
  • Date
  • Conversion

Multiple-Row Functions

Functions can manipulate groups of rows to give one result per group of rows. These functions are known as group functions. This is covered in a later lesson.

Single-Row Functions (continued)

This lesson covers the following single-row functions:
  • Character functionsAccept character input and can return both character and number values
  • Number functionsAccept numeric input and returns numeric values
  • Date functionsOperate on values of the DATE data type (All date functions return a value of DATE data type except the MONTHS_BETWEEN function, which returns a number.)
  • Conversion functionsConvert a value from one data type to another
  • General functions:
– NVL
– NVL2
– NULLIF
– COALSECE
– CASE
– DECODE


1. Character Functions


SELECT 'The job id for '||UPPER(last_name)||' is '
||LOWER(job_id) AS "EMPLOYEE DETAILS"
FROM employees;

SELECT employee_id, last_name, department_id
FROM employees
WHERE last_name = 'higgins';
                                              no rows selected
SELECT employee_id, last_name, department_id
FROM employees
WHERE LOWER(last_name) = 'higgins';

SELECT employee_id, UPPER(last_name), department_id
FROM employees
WHERE INITCAP(last_name) = 'Higgins';


Character-Manipulation Functions

SELECT employee_id, CONCAT(first_name, last_name) NAME, job_id,
LENGTH (last_name), INSTR(last_name, 'a') "Contains 'a'?"
FROM employees
WHERE SUBSTR(job_id, 4) = 'REP';


2 - Number Functions

• ROUND: Rounds value to specified decimal
   ROUND(45.926, 2) ----->  45.93
• TRUNC: Truncates value to specified decimal
  TRUNC(45.926, 2)----->  45.92
• MOD: Returns remainder of division
  MOD(1600, 300) ----->  100

SELECT ROUND(45.923,2), ROUND(45.923,0),
ROUND(45.923,-1)
FROM DUAL;

SELECT last_name, salary, MOD(salary, 5000)
FROM employees
WHERE job_id = 'SA_REP';

3 - Working with Dates

• MONTHS_BETWEEN ('01-SEP-95','11-JAN-94')                       19.6774194 
• ADD_MONTHS ('11-JAN-94',6)                    '11-JUL-94'      
• NEXT_DAY ('01-SEP-95','FRIDAY')                             '08-SEP-95'
• LAST_DAY('01-FEB-95')                                      '28-FEB-95'

SELECT SYSDATE
FROM DUAL;


SELECT last_name, (SYSDATE-hire_date)/7 AS WEEKS
FROM employees
WHERE department_id = 90;


SELECT employee_id, hire_date,
ROUND(hire_date, 'MONTH'), TRUNC(hire_date, 'MONTH')
FROM employees
WHERE hire_date LIKE '%97';


SELECT SYSDATE,ROUND(SYSDATE,'HH24') FROM dual;
           24-Nov-1999 09:23:56                 24-Nov-1999 09:00:00


SELECT TRUNC(last_analyzed,'HH')
FROM user_tables
WHERE table_name='TEST_CASE';


TRUNC(LAST_ANALYZED,
--------------------
28-Nov-1999 11:00:00


SELECT NEXT_DAY('01-Jan-2000','Monday') "1st Monday"
,NEXT_DAY('01-Nov-2004','Tuesday')+7 "2nd Tuesday"
FROM dual;

1st Monday                  2nd Tuesday
-----------                        -----------
03-Jan-2000               09-Nov-2004

4 - Conversion Functions


Data-type conversion :
  • Implicit data-type Conversion
  • Explicit data-type Conversion


TO_CHAR(date, 'format_model')
SELECT employee_id, TO_CHAR(hire_date, 'MM/YY') Month_Hired
FROM employees
WHERE last_name = 'Higgins';

Elements of the Date Format Model
YYYY Full year in numbers
YEAR Year spelled out
MM Two-digit value for month
MONTH Full name of the month
DY Three-letter abbreviation of the day of the week
DAY Full name of the day of the week
MON                    Three-letter abbreviation of the month
DD                       Numeric day of the month

SELECT last_name,
TO_CHAR(hire_date, 'fmDD Month YYYY') HIREDATE
FROM employees;


SELECT last_name,
TO_CHAR(hire_date, 'fmDdspth "of" Month YYYY fmHH:MI:SS AM')
HIREDATE
FROM employees;


TO_CHAR(number, 'format_model')


SELECT TO_CHAR(salary, '$99,999.00') SALARY
FROM employees
WHERE last_name = 'Ernst';


TO_NUMBER(char[, 'format_model'])
TO_DATE(char[, 'format_model'])


SELECT last_name, TO_CHAR(hire_date, 'DD-Mon-YYYY')
FROM employees
WHERE hire_date < TO_DATE('01-Jan-90', 'DD-Mon-RR');

Nesting Functions

SELECT last_name,
NVL(TO_CHAR(manager_id), 'No Manager')
FROM employees
WHERE manager_id IS NULL;

Example
Display the date of the next Friday that is six months from the hire date. The resulting date should appear as Friday, August 13th, 1999. Order the results by hire date.

SELECT TO_CHAR(NEXT_DAY(ADD_MONTHS
(hire_date, 6), 'FRIDAY'),
'fmDay, Month DDth, YYYY')
"Next 6 Month Review"
FROM employees
ORDER BY hire_date;


5 - General Functions

These functions work with any data type and pertain to using null value.
• NVL (expr1, expr2)
• NVL2 (expr1, expr2, expr3)
• NULLIF (expr1, expr2)
• COALESCE (expr1, expr2, ..., exprn)
– NVL(commission_pct,0)
– NVL(hire_date,'01-JAN-97')
– NVL(job_id,'No Job Yet')

SELECT last_name, salary, NVL(commission_pct, 0),
(salary*12) + (salary*12*NVL(commission_pct, 0)) AN_SAL
FROM employees;


Conditional Expressions

• Give you the use of IF-THEN-ELSE logic within a SQL statement
• Use two methods:
– CASE expression
– DECODE function

SELECT last_name, job_id, salary,
CASE job_id  WHEN 'IT_PROG' THEN 1.10*salary
                       WHEN 'ST_CLERK' THEN 1.15*salary
                       WHEN 'SA_REP' THEN 1.20*salary
ELSE salary  END  "REVISED_SALARY"
FROM employees;

Using the CASE Expression
In the preceding SQL statement, the value of JOB_ID is decoded. If JOB_ID is IT_PROG, the salary increase is 10%; if JOB_ID is ST_CLERK, the salary increase is 15%; if JOB_ID is SA_REP, the salary increase is 20%. For all other job roles, there is no increase in salary.


The same statement can be written with the DECODE function.
SELECT last_name, job_id, salary,
DECODE(job_id, 'IT_PROG', 1.10*salary,
               'ST_CLERK', 1.15*salary,
               'SA_REP', 1.20*salary,
salary)
REVISED_SALARY
FROM employees;


Group (Multi-row) Functions
  • AVG
  • COUNT
  • MAX
  • MIN
  • STDDEV
  • SUM
  • VARIANCE

Examples

Select MIN(AVG(salary)) from employees group by job_id

The example in the slide displays department numbers and maximum salaries for those departments whose maximum salary is greater than $10,000.

SELECT department_id, MAX(salary)
FROM employees
GROUP BY department_id
HAVING MAX(salary)>10000;

The example in the slide displays the job ID and total monthly salary for each job with a total payroll
exceeding $13,000. The example excludes sales representatives and sorts the list by the total monthly
salary.

SELECT job_id, SUM(salary) PAYROLL
FROM employees
WHERE job_id NOT LIKE '%REP%'
GROUP BY job_id
HAVING SUM(salary) > 13000
ORDER BY SUM(salary);


How to Add Optimized Meta Tags to your Blogger

How to Add Optimized Meta Tags to your Blogger

SEO (Search Engine Optimization) is important for every blog and website. An important part of SEO are meta tags, which are commonly located in the header of our website.


Meta Description

Go to your blog Setting > Search > Preference > Meta Tags > Description and click on Edit Link.


After adding Click box "Yes" to enable search description. Finally, Click "Save Changes" button.

Meta Description for Individual posts

Go to your page or post, look Search Description setting from drop down "Posting Setting".
Add brief desceiption of your post.


What is CSS?


What is CSS?

  • CSS stands for Cascading Style Sheets
  • CSS describes how HTML elements are to be displayed on screen, paper, or in other media
  • CSS saves a lot of work. It can control the layout of multiple web pages all at once
  • External stylesheets are stored in CSS files

CSS is short for Cascading Style Sheets, and is the preferred way for setting the look and feel of a website. The style sheets define the colour, size and position of text and other HTML tags, while the HTML files define the content and how it is organised. Separating them allows you to change the colour scheme without having to rewrite your entire web site.

The cascading means that a style applied to a parent element will also apply to all children elements within the parent. For example, setting the colour of body text will mean all headings and paragraphs within the body will also be the same colour.


Why Use CSS?

CSS is used to define styles for your web pages, including the design, layout and variations in display for different devices and screen sizes.

CSS Solved a Big Problem

HTML was NEVER intended to contain tags for formatting a web page!

HTML was created to describe the content of a web page, like:

<h1>This is a heading</h1>

<p>This is a paragraph.</p>

When tags like <font>, and color attributes were added to the HTML 3.2 specification, it started a nightmare for web developers. Development of large websites, where fonts and color information were added to every single page, became a long and expensive process.

To solve this problem, the World Wide Web Consortium (W3C) created CSS.

CSS removed the style formatting from the HTML page!

CSS Saves a Lot of Work!
The style definitions are normally saved in external .css files.

With an external stylesheet file, you can change the look of an entire website by changing just one file!


Inline Styles
Styles defined inline in HTML will only apply to the tag they are added to. Note: colours can be specified as either a CSS colour name or hex colour code.

<p style="color:red;">Some red text</p>


Within the HTML header
A style defined in the header will apply to the whole page. The example below will make all h1 tags in your page show the heading in red.

<head>
<style type="text/css">
 h1 {
   color: red;
 }
</style>
</head>


External CSS file
Like HTML files, CSS files are also plain text, and usually have a .css file extension. An example of a CSS file name style.css can be seen below.

body {
  background-color: beige;
  color: #000080;
}
h1 {
  color: red;
}

The file can then be included using the <link ... > tag in the HTML header.

<head>
<link rel="stylesheet" type="text/css" href="style.css" title="style">
</head>


SSRS Tutorial Overview

SSRS Tutorial Overview

SQL Server Reporting Services (SSRS)

ssrs tutorial Overview
In this set of tutorials, we will be learning microsoft sql server 2008 reporting services. This set of tutorials, is designed for anyone with absolutely no experience in business intelligence SSRS or sql server reporting services. We will also walk through sql reporting services configuration, creating your first report, deploying, security etc.

The SSRS service provides a unique interface into Microsoft Visual Studio so that developers as well as SQL administrators can connect to SQL databases and use SSRS tools to format SQL reports in many complex ways. SSRS also provides a 'Report Builder' tool for less technical IT workers to format SQL reports of lesser complexity.

SQL Server Reporting Services 2008 (SSRS) is a feature included in the SQL Server 2008 product. We use SSRS to design, develop, test, and deploy reports. SSRS was originally slated to be released with SQL Server 2005 but it wound up being released a little bit ahead of SQL Server 2005. SSRS leverages the Business Intelligence Development Studio (BIDS) developer tool for all aspects of authoring and deploying reports. BIDS is included with SQL Server 2008.

In this tutorial we will step through a number of topics that you need to understand to successfully build a report. Our high level outline is as follows:
  • Reporting Services Components
  • Install Reporting Services
  • Business Intelligence Development Studio (BIDS)
  • Install Sample Database
  • Create a Simple Report with the Wizard
  • Create a Simple Report with the Report Designer
  • Deploy Reports
  • Configure Report Manager Security